Keywords AI
Modern LLM systems rarely execute as a single model call.
Yet many observability setups still treat a chat completion as the primary or only unit of execution. This works for simple demos, but breaks down once you introduce tools, memory, retries, or agents.
To understand real LLM behavior, you need to distinguish log/event types, spans, and traces and understand how they fit together.
This post explains that execution model and how to reason about it in practice.
From flat logs to typed events
Most systems start with logs. You track things like:
- prompt
- response
- latency
- token usage
These logs tell you what happened, but they don't tell you what kind of thing happened.
In real LLM systems, a single request can produce many different types of events:
- model inference
- tool invocation
- memory access
- retries and fallbacks
- errors
When you flatten all of these into a single log stream, you lose the execution structure.
Different event (log) types
A useful observability model starts by typing events. This means categorizing what happened.
| Event type | What it represents |
|---|---|
| Model inference | A single LLM call |
| Tool call | Invocation of an external tool or function |
| Memory access | Reads/writes to state, cache, or vector stores |
| Control flow | Branches, retries, fallbacks |
| Error | Failures, timeouts, malformed outputs |
Typed events answer a simple question:
What kind of thing just happened?
This distinction is the foundation of an LLM observability data model. For a formal definition of these concepts, see the Observability Data Model.
Why a chat completion is not a span
A span is not a log entry.
A span represents a bounded unit of execution. Think of it like this:
- it has a start
- it has an end
- it represents one logical step
A chat completion often contains multiple logical steps:
- prompt assembly
- the model call itself
- tool-triggered actions
- retries or streaming behavior
When you treat the entire request as a single span, you collapse all of this into a black box.
What should be a span?
In practice, spans map to execution boundaries, not outputs:
- one model invocation
- one tool execution
- one memory read/write
- one retry attempt
Each span can emit multiple logs or events, but the span defines where execution begins and ends.
Traces are groups of spans
A trace is not a timeline of logs.
A trace is a group of related spans that together represent one request's execution.
This structure preserves important information:
- parent-child relationships
- ordering
- parallelism
Example trace structure
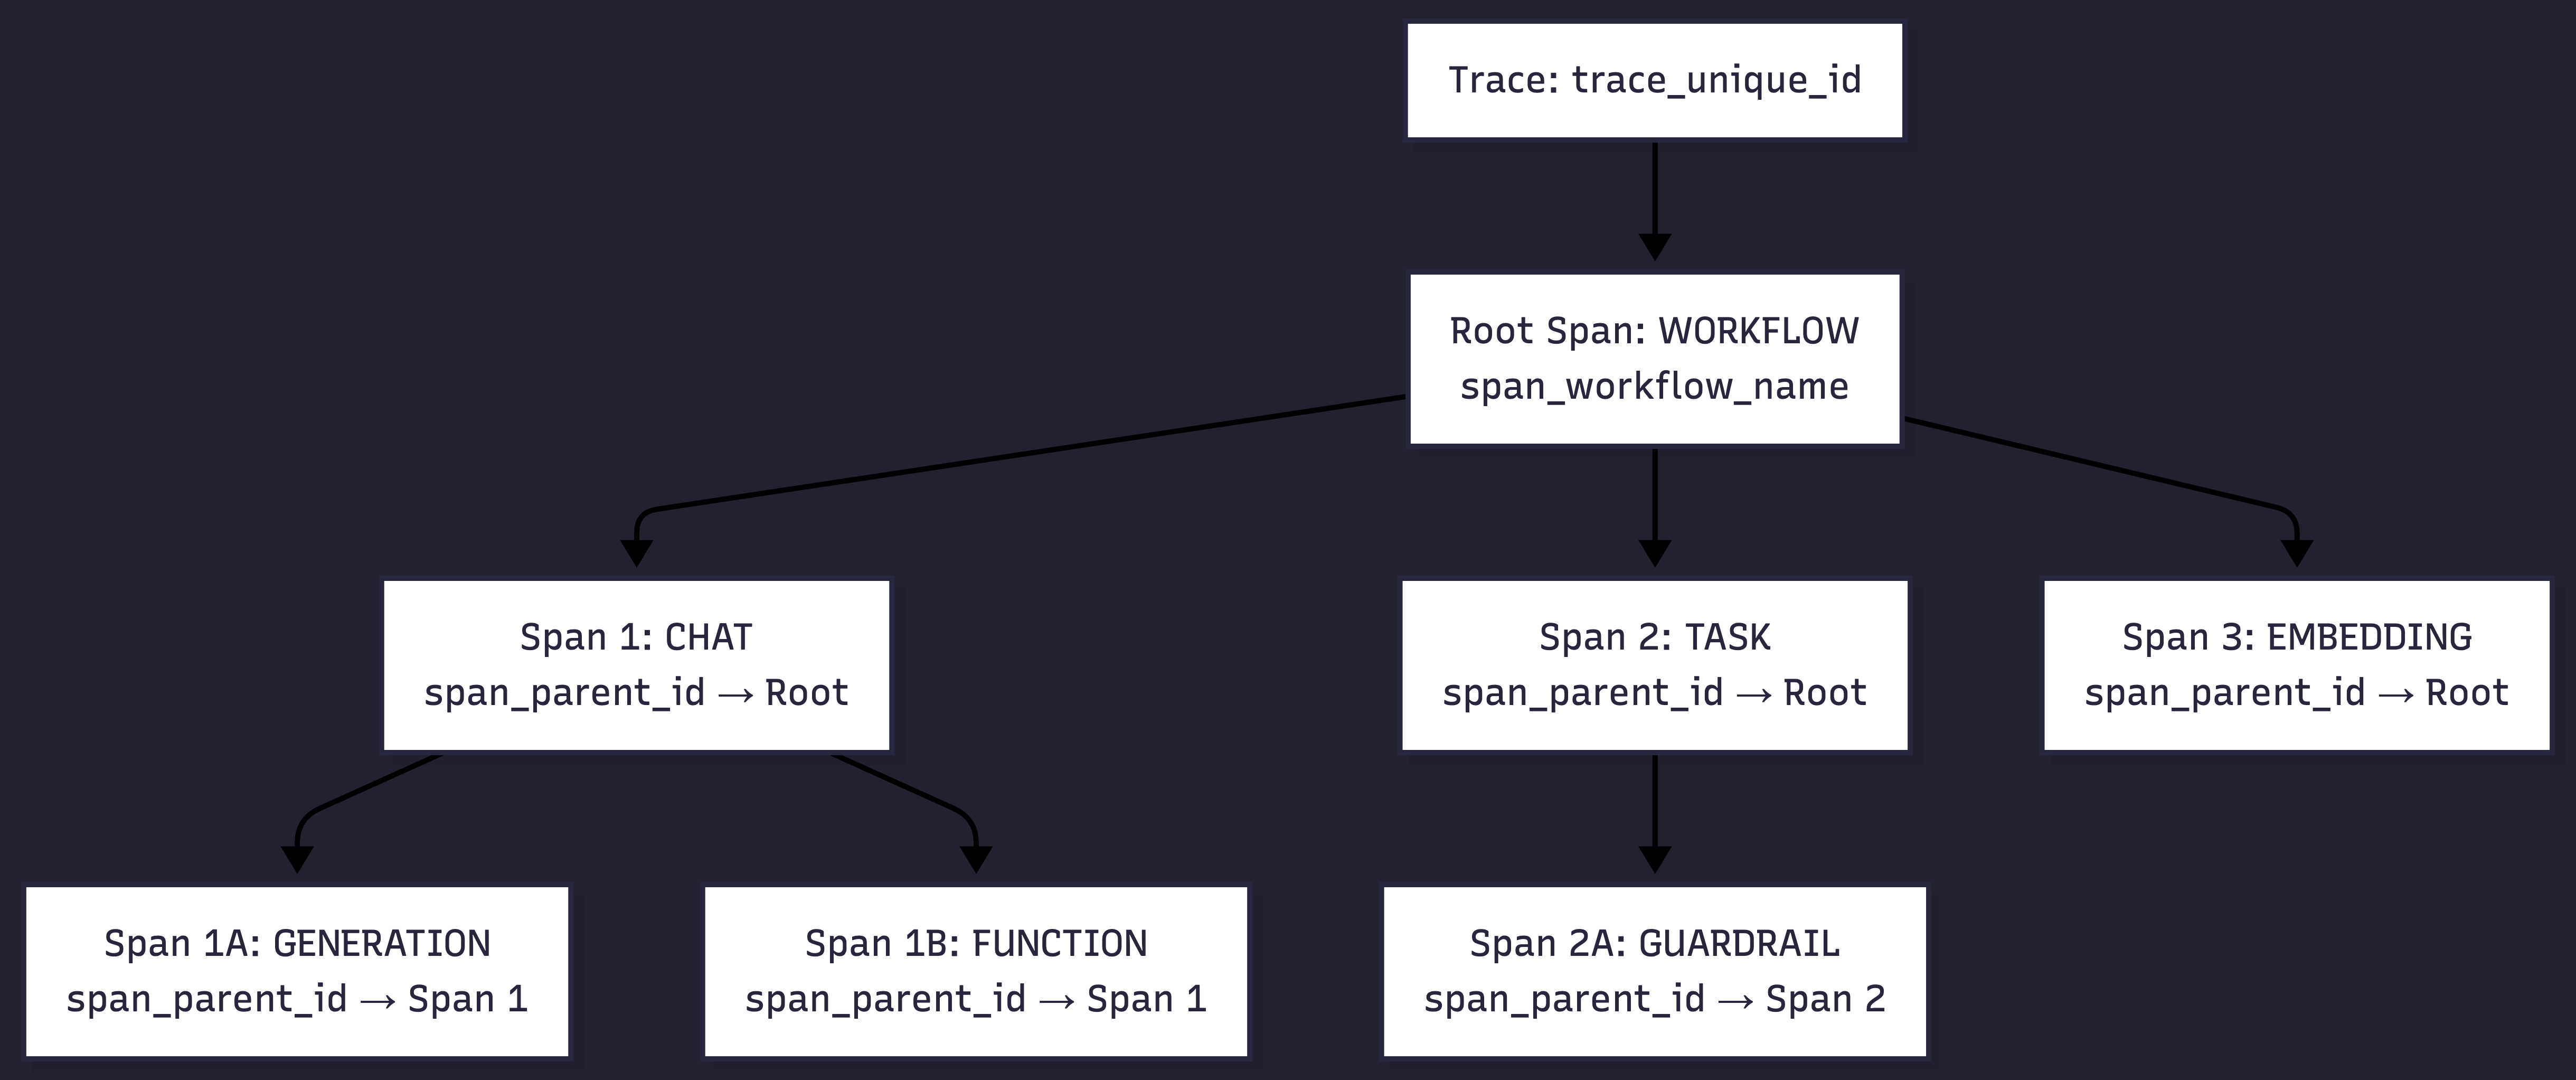
In this trace:
- each node is a span
- edges represent execution relationships
- the trace explains how execution flowed, not just when it happened
Logs vs spans vs traces
It helps to be explicit about the role each concept plays:
| Concept | Answers |
|---|---|
| Log / Event | What happened? |
| Span | What unit of execution ran? |
| Trace | How did execution flow? |
Here's the thing: logs without spans lose boundaries. Spans without traces lose structure. Traces without typed events lose meaning.
Multi-step execution makes structure necessary
Agent and workflow-based systems make this distinction unavoidable.
A single request might:
- branch into parallel tool calls
- retry failed steps
- follow different execution paths on different runs
Multi-step execution example

Why this model makes debugging possible
Once execution is modeled explicitly, things get clearer:
- failures attach to spans, not guesses
- metrics attach to execution steps, not summaries
- behavior differences become explainable
Instead of asking:
"Why was the output bad?"
You can ask:
"Which span failed or behaved differently?"
This shift is what makes observability actually useful.
Putting it all together
The correct mental model is not:
one request → one completion → one log
It is:
one request → many typed events → bounded spans → one trace
This structure reflects how LLM systems actually run in production.
The full execution model, including event types, spans, traces, and relationships, is defined in the Observability Data Model documentation.
Closing thoughts
Chat completions are still important. They're just one event among many.
If you only log completions, LLM behavior will always feel opaque. But if you model execution with typed events, spans, and traces, failures stop being mysterious.
Observability isn't about collecting more logs. It's about modeling execution correctly.